
这篇笔记整理两类问题:
- 训练时如何根据硬件选择
batch_size、num_workers、prefetch_factor、use_amp等参数。 - 推理时为什么低 FPS 不一定更快,以及 CPU 省电策略如何影响端到端延迟。
Recommended Training Command
下面是当前 ACT 训练的基准启动方式。核心思路是:GPU 侧启用 AMP,CPU 侧限制线程过度竞争,并通过 dataloader worker 与 prefetch 把数据准备尽量前移。
			ACCELERATE_MIXED_PRECISION=bf16 \
OMP_NUM_THREADS=1 \
MKL_NUM_THREADS=1 \
taskset -c 0-31 \
python train/train.py \
  --joint_select \
  --policy.type=act \
  --policy.use_amp=true \
  --dataset.repo_id=LogicDeposit/bb_things_merged_improved_15hz \
  --dataset.root=data/processed/bb_things_merged_improved_15hz/ \
  --policy.repo_id=LogicDeposit/bb_things_merged_improved_15hz_act \
  --output_dir=ckpt/bb_things_merged_improved_15hz/act/improved/$(date +%Y%m%d_%H%M%S) \
  --wandb.enable=false \
  --batch_size=8 \
  --num_workers=12 \
  --prefetch_factor=4 \
  --persistent_workers=true \
  --policy.chunk_size=30 \
  --policy.n_action_steps=30 \
  --dataset.video_backend=pyav \
  --dataset.image_transforms.enable=true \
  --epochs=80
Parameter Tuning Rules
batch_size 先由显存决定。优先从能稳定跑满一个 epoch 的最大 batch 开始,再观察 torch.cuda.max_memory_allocated() 和 nvidia-smi 的 reserved memory。如果 OOM,先降 batch_size,再考虑冻结 backbone、gradient checkpointing 或降低输入分辨率。
num_workers 由 CPU 解码和数据增强开销决定。视频读取、图像 decode、resize、augmentation 较重时,num_workers 通常比默认值更重要。可以从 CPU physical cores / 2 开始试,观察 GPU util 是否仍有周期性掉空。
prefetch_factor 控制每个 worker 预取多少个 batch。它能减少 GPU 等数据的概率,但会增加 CPU RAM 和 pinned memory 压力。经验上 2-4 比较稳,worker 数较高时不要盲目继续加。
persistent_workers=true 适合长时间训练,可以避免每个 epoch 反复创建 worker。数据集初始化较重时收益明显。
use_amp=true 基本应当默认开启。ACT 这类 CNN + Transformer 结构中,AMP 能显著降低 activation memory,并提升 Tensor Core 利用率。需要留意 loss scale、数值稳定性,以及某些自定义 op 是否支持 bf16/fp16。
OMP_NUM_THREADS=1 和 MKL_NUM_THREADS=1 用来避免 dataloader worker 里每个进程继续开大量 OpenMP/MKL 线程。多 worker 场景下,如果不限制,CPU 很容易被线程调度和上下文切换拖慢。
Inference Case Study: 30 FPS Slower Than 60 FPS
Symptom
在 12 代 Intel + RTX 4090 上,30 FPS 推理单次墙钟时间反而比 60 FPS 慢。直觉上,30 FPS 至少应该和 60 FPS 一样快,因为每帧之间有更长的空闲时间。
测试命令如下,分别使用 --fps 30 和 --fps 60 对比:
			python scripts/launch_sync.py \
  --model_path ckpt/AdamU_260526_bb_things_0526_everything/act/regular/20260527_003105/checkpoints/100000/pretrained_model \
  --dataset_path data/adamu/processed/AdamU_041088_DexHand_v000/bb_things_0526_everything_30hz/ \
  --cameras head:remote:640:360:10.10.20.126:16003 \
            wrist_left:remote:640:480:10.10.20.126:16013 \
            wrist_right:remote:640:480:10.10.20.126:16023 \
  --robot_ip 10.10.20.127 \
  --camera_source zmq \
  --fps 30 \
  --temporal_ensemble_coeff 0.01
GPU Check
			nvidia-smi dmon -s pucm -d 1
# gpu    pwr  gtemp  mtemp     sm    mem    enc    dec    jpg    ofa   mclk   pclk     fb   bar1   ccpm
# Idx      W      C      C      %      %      %      %      %      %    MHz    MHz     MB     MB     MB
#   0     21     37      -     23      9      0      0      0      0    405    645    433     30      0
#   0     21     37      -     36     17      0      0      0      0    810    675    433     30      0
观察到 30 Hz 推理墙钟时间多了约 7-8 ms,但 GPU 利用率没有相应增加。这说明多出的时间大概率不是 GPU 计算变慢,而是 CPU 侧调度和 kernel launch 延迟被同步计时包含了进去。
可能原因:
- 30 Hz 的帧间隔更长,CPU 更容易降频或进入更深的 C-state。
- 下一周期开始时,CPU 唤醒、Python 调度和 CUDA kernel launch 变慢。
- ACT 推理包含多个 CUDA kernel,CPU 提交延迟会被端到端计时放大。
- 60 Hz 时 CPU 持续活跃,反而维持了更高频率和更低唤醒延迟。
- 离线验证时数据读取和处理让 CPU 持续活跃,所以不同 FPS 下都约 14.4 ms。
CPU Frequency Check
watch -n 0.5 'grep "cpu MHz" /proc/cpuinfo | awk "{sum+=\$4} END {print sum/NR \" MHz\"}"'
watch -n 0.5 'grep "cpu MHz" /proc/cpuinfo | awk "{sum+=\$4} END {print sum/NR \" MHz\"}"'
实测中,30 Hz 时 CPU 大约在 1.7-3.5 GHz 波动,60 Hz 时更稳定地接近 4.0 GHz。
再检查 governor:
			cat /sys/devices/system/cpu/cpu0/cpufreq/scaling_governor
# powersave
			cat /sys/devices/system/cpu/cpu0/cpufreq/scaling_governor
# powersave
powersave 会在空闲时主动降频,这正好解释了 30 Hz 更容易出现额外延迟的现象。
Fix
把 CPU governor 切到 performance 后重新测试:
sudo cpupower frequency-set -g performance
sudo cpupower frequency-set -g performance
测试结果是 30 Hz 和 60 Hz 都稳定在约 4.0 GHz,30 Hz 的额外 7-8 ms 延迟也随之消失或明显降低。
Useful Commands
查看可用 governor:
			cpupower frequency-info | grep "available cpufreq governors"
# available cpufreq governors: performance powersave
			cpupower frequency-info | grep "available cpufreq governors"
# available cpufreq governors: performance powersave
查看每个 CPU core 的最大频率:
grep . /sys/devices/system/cpu/cpu*/cpufreq/cpuinfo_max_freq
grep . /sys/devices/system/cpu/cpu*/cpufreq/cpuinfo_max_freq
示例输出:
			/sys/devices/system/cpu/cpu0/cpufreq/cpuinfo_max_freq:4900000
/sys/devices/system/cpu/cpu8/cpufreq/cpuinfo_max_freq:5000000
/sys/devices/system/cpu/cpu16/cpufreq/cpuinfo_max_freq:3800000
			/sys/devices/system/cpu/cpu0/cpufreq/cpuinfo_max_freq:4900000
/sys/devices/system/cpu/cpu8/cpufreq/cpuinfo_max_freq:5000000
/sys/devices/system/cpu/cpu16/cpufreq/cpuinfo_max_freq:3800000
ACT Memory Estimate
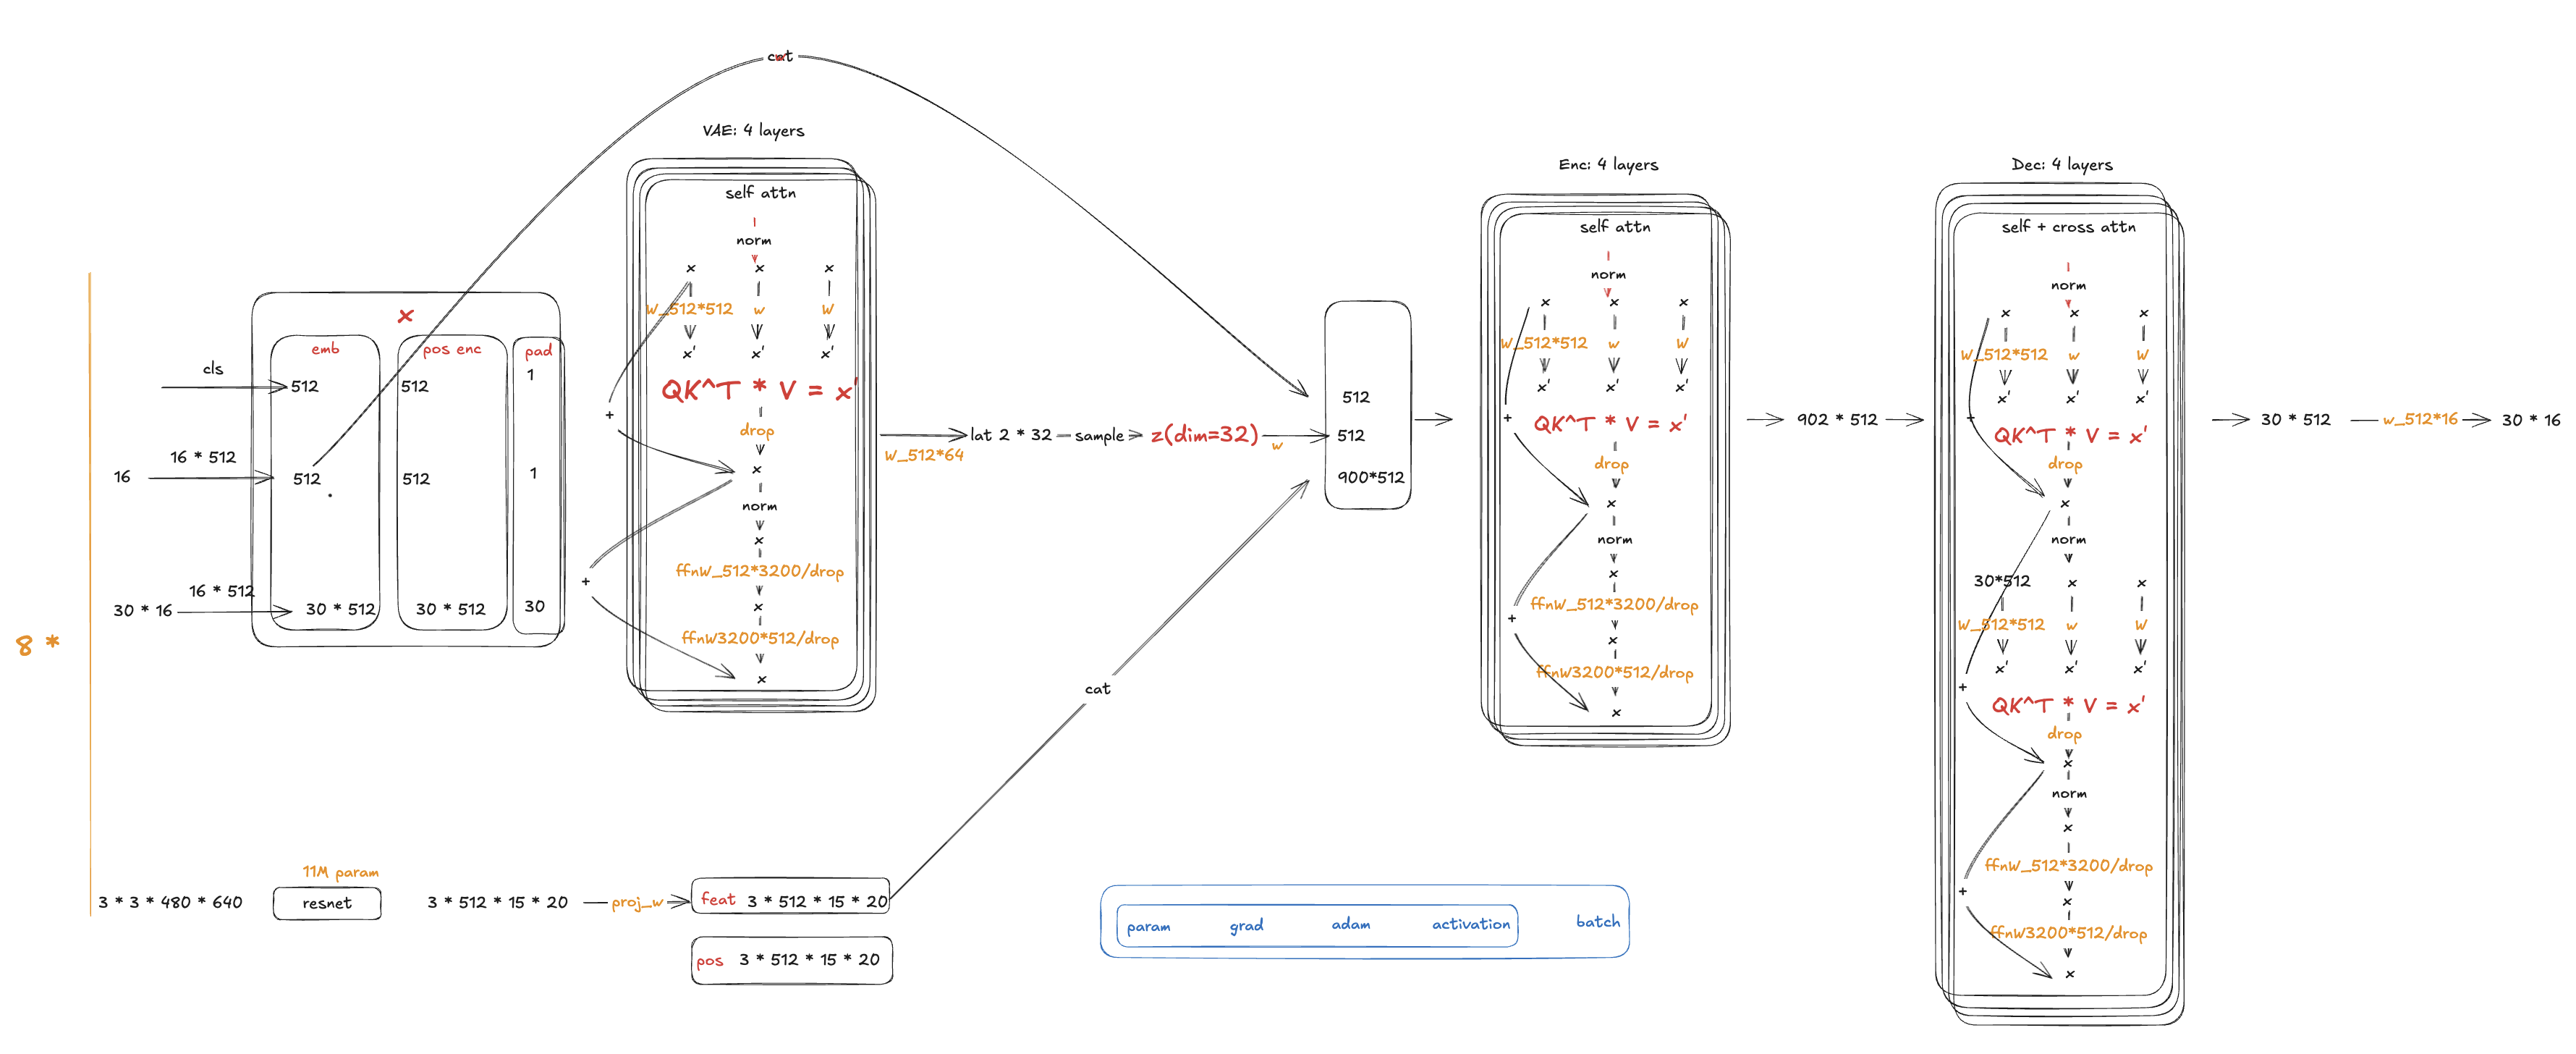
ACT architecture detail
下面是 ACT 训练 AMP 显存的粗估模型:
			ACT training AMP memory
  ~= P * 16
   + B * 2 * [
       CNN_acts_per_sample
       + L * (S * D + H * S^2 + S * FFN)
       + VAE_or_decoder_acts_per_sample
     ]
   + 10%-30% extra buffer
			ACT training AMP memory
  ~= P * 16
   + B * 2 * [
       CNN_acts_per_sample
       + L * (S * D + H * S^2 + S * FFN)
       + VAE_or_decoder_acts_per_sample
     ]
   + 10%-30% extra buffer
其中:
			B = 8
S = 842
D = 512
H = 8
FFN = 3200
L = 4
P ~= 52M
AMP activation = 2 bytes
AdamW parameter states ~= 16 bytes / parameter
			B = 8
S = 842
D = 512
H = 8
FFN = 3200
L = 4
P ~= 52M
AMP activation = 2 bytes
AdamW parameter states ~= 16 bytes / parameter
Parameter State
			P * 16 = 52M * 16
       = 832 MB
       ~= 0.77 GiB
			P * 16 = 52M * 16
       = 832 MB
       ~= 0.77 GiB
实际训练还要考虑 AMP 和 optimizer 的临时 buffer,估算为:
0.9-1.3 GiB
0.9-1.3 GiB
Transformer Main Encoder Activation
更完整的单层估计:
elements_per_layer ~= 8 * S * D + 2 * H * S^2 + 2 * S * FFN
elements_per_layer ~= 8 * S * D + 2 * H * S^2 + 2 * S * FFN
含义:
			8 * S * D    ~= Q/K/V, attention output, projection output, residual, LayerNorm
2 * H * S^2  ~= attention score + attention probability
2 * S * FFN  ~= FFN hidden + activation/dropout intermediates
			8 * S * D    ~= Q/K/V, attention output, projection output, residual, LayerNorm
2 * H * S^2  ~= attention score + attention probability
2 * S * FFN  ~= FFN hidden + activation/dropout intermediates
代入:
			S * D   = 842 * 512      = 431,104
H * S^2 = 8 * 842^2      = 5,671,712
S * FFN = 842 * 3200     = 2,694,400

8 * S * D     = 3,448,832
2 * H * S^2   = 11,343,424
2 * S * FFN   = 5,388,800

total = 20,181,056 elements / sample / layer
			S * D   = 842 * 512      = 431,104
H * S^2 = 8 * 842^2      = 5,671,712
S * FFN = 842 * 3200     = 2,694,400

8 * S * D     = 3,448,832
2 * H * S^2   = 11,343,424
2 * S * FFN   = 5,388,800

total = 20,181,056 elements / sample / layer
4 层、batch size 8、AMP activation 2 bytes:
			B * L * 2 bytes * 20,181,056
= 8 * 4 * 2 * 20,181,056
= 1,291,587,584 bytes
~= 1.20 GiB
			B * L * 2 bytes * 20,181,056
= 8 * 4 * 2 * 20,181,056
= 1,291,587,584 bytes
~= 1.20 GiB
再考虑 backward 临时 buffer、dropout mask 和 PyTorch 的保存策略:
main encoder ~= 1.3-1.8 GiB
main encoder ~= 1.3-1.8 GiB
CNN Backbone Activation
三相机 ResNet18 输入:
640x360 + 640x480 + 640x480
640x360 + 640x480 + 640x480
ResNet 早期 feature map 较大,并且训练时需要保存 residual、BN、ReLU 等反向信息。AMP 下估算为:
CNN backbone activation ~= 1.5-2.5 GiB
CNN backbone activation ~= 1.5-2.5 GiB
如果 backbone 没有冻结,这是主要显存来源之一。
VAE Encoder And Decoder
VAE 序列长度:
S_vae = 1 + 1 + chunk_size = 32
S_vae = 1 + 1 + chunk_size = 32
Decoder query 长度:
S_dec = 30
S_dec = 30
这两部分 token 较短,但仍包含 FFN 和 cross-attention:
			VAE encoder ~= 0.15-0.30 GiB
decoder     ~= 0.10-0.25 GiB
total       ~= 0.25-0.55 GiB
			VAE encoder ~= 0.15-0.30 GiB
decoder     ~= 0.10-0.25 GiB
total       ~= 0.25-0.55 GiB
Input, Loss, And Temporary Tensors
三路图像 batch 使用 FP32 时:
			8 * 3 * (640 * 360 + 640 * 480 + 640 * 480) * 4
~= 81 MB
~= 0.075 GiB
			8 * 3 * (640 * 360 + 640 * 480 + 640 * 480) * 4
~= 81 MB
~= 0.075 GiB
加上 normalize、list/stack、action chunk、mask、loss 等临时张量:
0.2-0.5 GiB
0.2-0.5 GiB
Workspace And Cache
workspace / PyTorch cache / optimizer temporary buffers ~= 0.8-1.8 GiB
workspace / PyTorch cache / optimizer temporary buffers ~= 0.8-1.8 GiB
这部分取决于 cuDNN、attention backend、AdamW foreach,以及 allocator reserved memory。
Final Estimate
			parameter / gradient / AdamW: 0.9-1.3 GiB
CNN activation:              1.5-2.5 GiB
main encoder activation:     1.3-1.8 GiB
VAE + decoder:               0.25-0.55 GiB
input / temporary tensors:   0.2-0.5 GiB
workspace / cache:           0.8-1.8 GiB
			parameter / gradient / AdamW: 0.9-1.3 GiB
CNN activation:              1.5-2.5 GiB
main encoder activation:     1.3-1.8 GiB
VAE + decoder:               0.25-0.55 GiB
input / temporary tensors:   0.2-0.5 GiB
workspace / cache:           0.8-1.8 GiB
合计:
			torch.cuda.max_memory_allocated ~= 5.0-7.0 GiB
nvidia-smi / reserved          ~= 6.5-9.5 GiB
			torch.cuda.max_memory_allocated ~= 5.0-7.0 GiB
nvidia-smi / reserved          ~= 6.5-9.5 GiB
如果实测显存是 6.5 GiB,这个估算是吻合的。单点估计可以写成:
			allocated ~= 6.2 GiB
reserved / nvidia-smi ~= 7.5 GiB
actual training test ~= 6.5 GiB
			allocated ~= 6.2 GiB
reserved / nvidia-smi ~= 7.5 GiB
actual training test ~= 6.5 GiB
Secondary Case: VGG16 VRAM Estimate
ACT 是这篇文章的核心,因为它同时包含 CNN image encoder、Transformer encoder/decoder、VAE、dataloader 压力和 realtime inference 约束。VGG16 这种 CNN-only 例子更适合作为一个小的 sanity check,用来校准同一套显存估算方法。
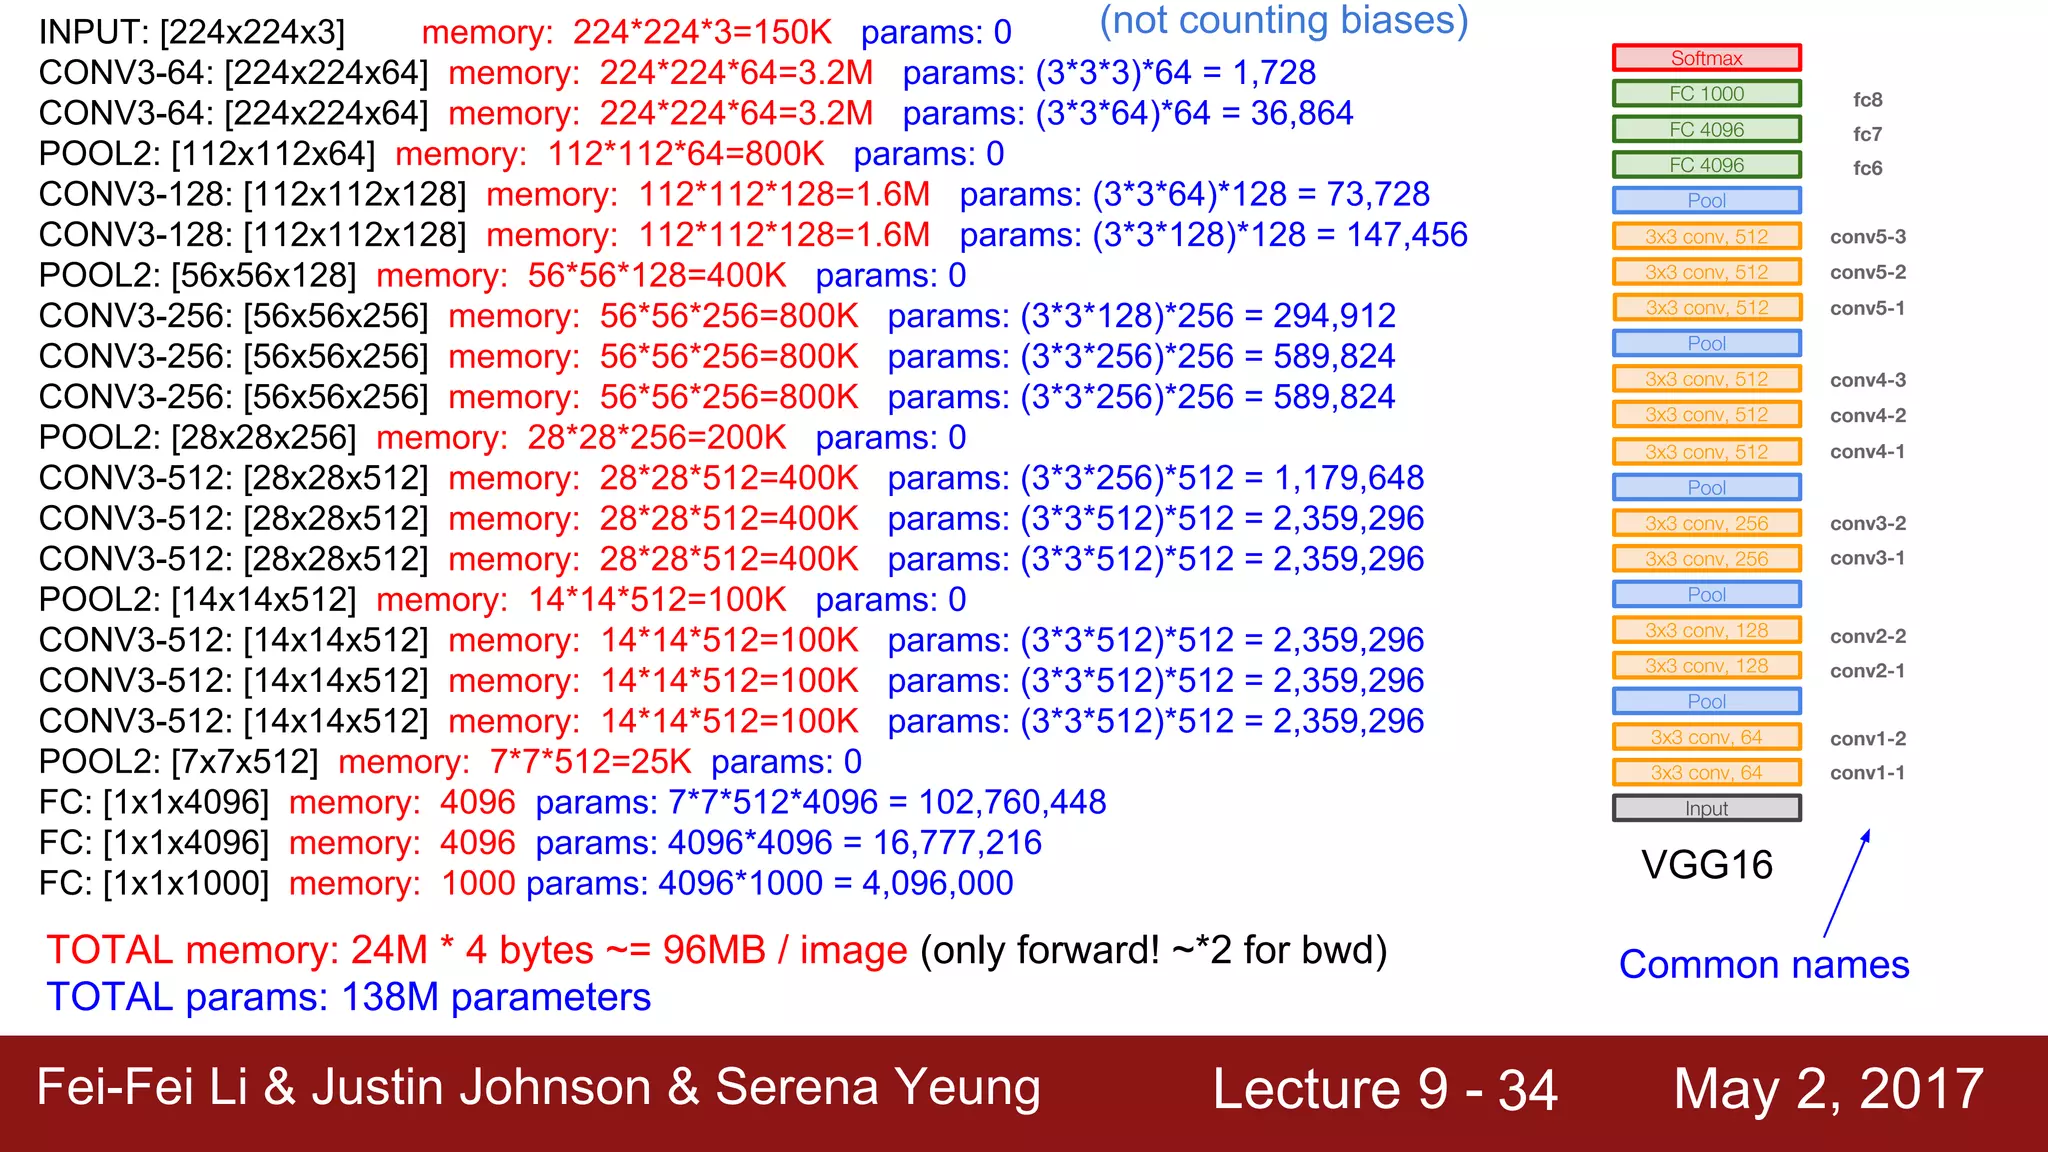
VGG16 total memory estimate
一个简单 CNN 的一阶估算可以写成:
VRAM ~= model parameters + middle variables * batch size
VRAM ~= model parameters + middle variables * batch size
以 FP32 的 VGG16 为例:
			parameters ~= 138M
middle variables ~= 96M / image
batch size = 32
			parameters ~= 138M
middle variables ~= 96M / image
batch size = 32
那么一个 batch 的显存需求大约是:
(0.138 * 4 + 0.096 * 2 * 32) * 4 ~= 6.4 GB
(0.138 * 4 + 0.096 * 2 * 32) * 4 ~= 6.4 GB
这个例子比 ACT 简单很多。它主要说明一个经验规则:参数量通常是固定成本,activation 会随着输入分辨率、模型深度、精度和 batch size 扩大。ACT 还要额外考虑 CNN backbone、Transformer attention matrix、decoder query、optimizer state、workspace 和 allocator cache,所以 VGG16 只能作为对照案例,不能直接替代 ACT 的估算。
可以用一个最小 forward pass 来观察显存变化:
			import torch
import torchvision.models as models
from torchinfo import summary

model = models.resnet18().cuda()
summary(model, input_size=(1, 3, 256, 256))


def get_memory_usage():
    allocated_memory = torch.cuda.memory_allocated()
    reserved_memory = torch.cuda.memory_reserved()
    return allocated_memory, reserved_memory


input_tensor = torch.randn(1, 3, 256, 256).cuda()
allocated_before = get_memory_usage()[0]
output = model(input_tensor)
allocated_after = get_memory_usage()[0]

print(f"Before forward: {allocated_before / (1024**2):.2f} MB")
print(f"After forward: {allocated_after / (1024**2):.2f} MB")
print(f"Forward memory: {(allocated_after - allocated_before) / (1024**2):.2f} MB")
Practical Checklist
- GPU 利用率周期性掉空:优先检查
num_workers、prefetch_factor、视频 backend、数据增强耗时。 - CPU 使用率很高但 GPU 不满:限制
OMP_NUM_THREADS、MKL_NUM_THREADS,避免 worker 内部线程膨胀。 - 显存接近上限:先降
batch_size,再评估冻结 backbone、降低分辨率或使用 gradient checkpointing。 - 低 FPS 推理反而更慢:检查 CPU governor、CPU MHz、C-state、Python 调度和 CUDA kernel launch 延迟。
nvidia-smi显存高于 PyTorch allocated:通常是 reserved memory、workspace、allocator cache 和 cudnn workspace 的差异。